
Create a Movement with Data
I find myself sitting at my desk way too often. So when a friend asked recently if anyone was interested in a combined team effort of walking more regularly, I thought group accountability might be exactly the motivation I needed. We quickly had thirty people committed to chipping away at our group goal.
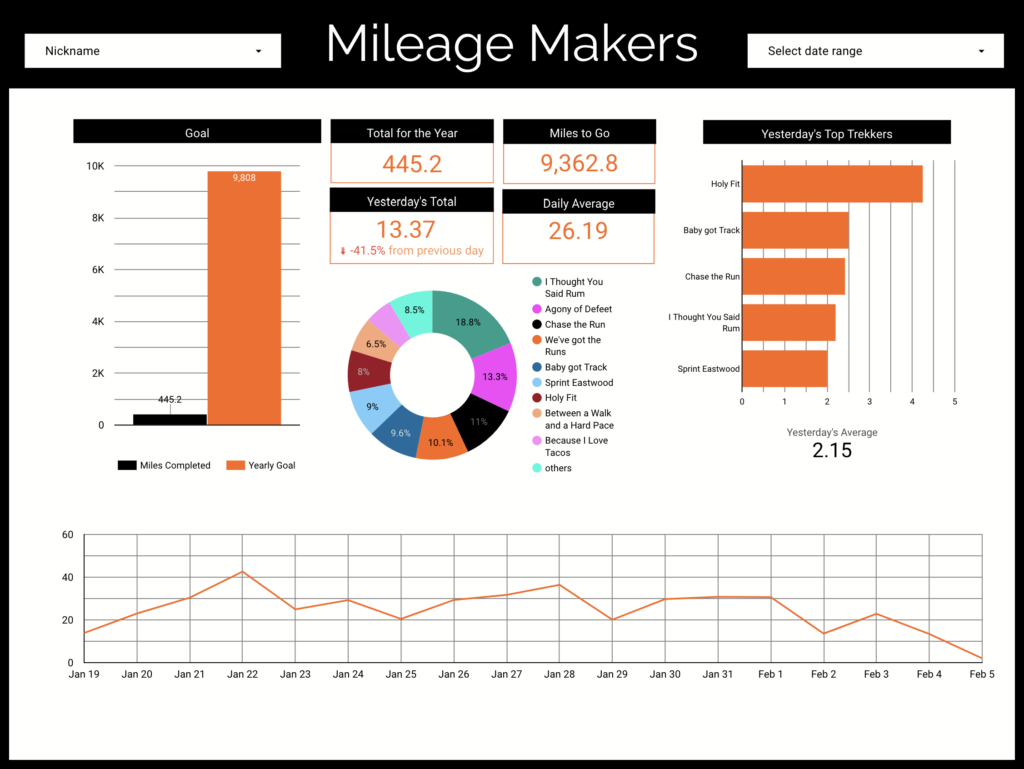
Among this circle of friends, I am the one known to enjoy a good spreadsheet (guilty). So when they asked if I could track our mileage, I decided I could do a little better than a bunch of numbers in a grid. I created a basic Google Form connected to Google Data Studio report, allowing people an easy interface to enter their daily mileage and a visual way to monitor both our team and individual progress.
Having only spent a few hours one weekend on the solution, it was certainly not going to win any awards. By the standards of our Data Analytics team at Five Star, the dashboard was pretty basic. Limited functionality, a glitch here and there, and an interface that might make Joanna Gaines cringe. (I went with an orange and black color scheme because my friend is a San Francisco Giants fan.)
And, yet, despite the rudimentary design and features, a few surprising events unfolded:
- I enjoyed seeing our bar graph nudge upward at the end of each day.
- Others expressed how much they liked the dashboard.
- I started walking more.
So when a group of my colleagues at Five Star also expressed the desire to create a walking/running club, I reluctantly offered to roll out a copy of the primitive dashboard. Pretty quickly Mileage Makers (as we called it) was born within the “Five Star Fitness” group.
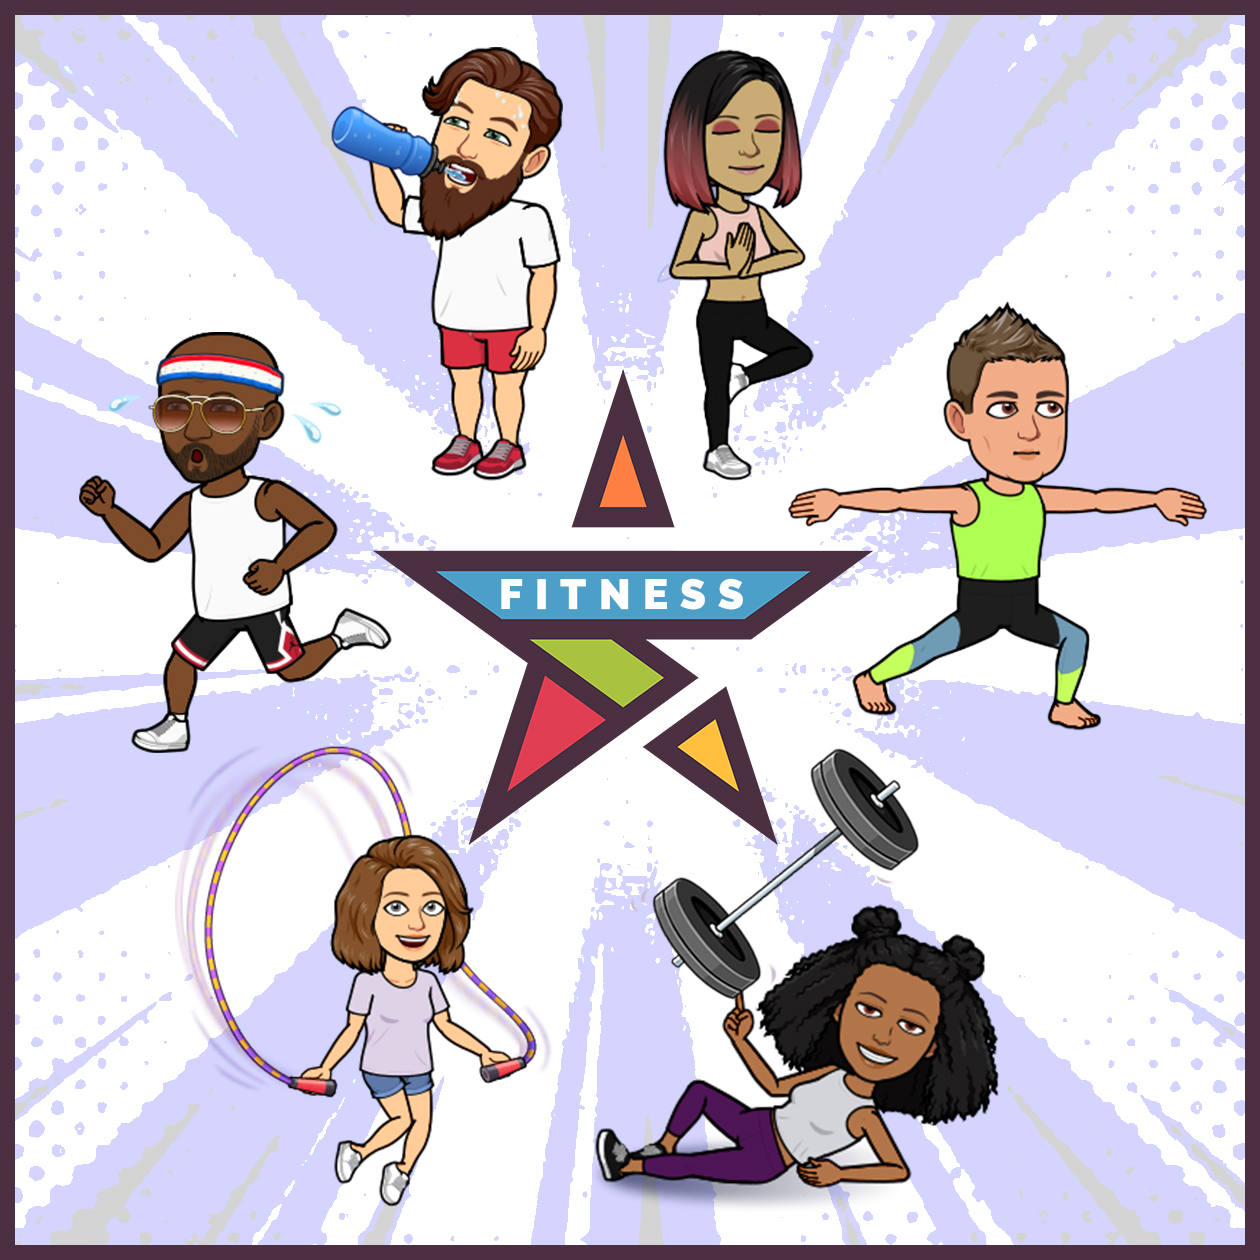
Even though this make-shift dashboard may have not lived up to my professional standards, it began to take on a life of its own. In addition to walking more, our team offered ideas of how to improve the dashboard, and one of our marketing team members delighted us all by creating a Five Star Fitness bitmoji. The experience was another example of why I love data dashboards and a reminder of some important tips that anyone should consider when using data with their team:
Don’t just disaggregate data. Unite people.
Although my simplistic Mileage Maker dashboard lets people monitor their individual mileage and set their own goals, that’s not the point. (I would imagine everyone participating already has a way they do that.) The appeal of this dashboard had little to do with what I made and everything to do with what others are made of. People want to rally for a cause, monitor their team’s progress, and celebrate shared successes. So, whether you are looking for a dashboard that tracks mileage or student achievement, consider how your team can use the information to create shared goals and move forward together.
Don’t just crunch numbers. Create connections.
The Five Star Mileage Maker walker/runner nicknames include titles like Agony of Defeet, Baby Got Track, and Because I Love Tacos. Letting people choose their own nicknames wasn’t just a way to keep the mileage of each person anonymous, it was a way to bring out our team’s personalities. I also find great joy in seeing the miles accumulate with runners like I Thought You Said Rum. So, although not all your team’s conversations about data have to be funny, they can still be fun.
 Don’t just identify problems. Celebrate progress.
Both of the walking/running clubs I joined weren’t focused on bragging about who ran the most or shaming those just beginning a new walking/running routine. In fact, the point of forming both groups was to promote healthier habits for those of us who wanted to simply become a better version of ourselves. Likewise, having your team analyze data isn’t about identifying differences in the data; it’s about recognizing the difference you can make because of the data.
Schools face growing pressures that range from raising student academic performances, ensuring student safety, and keeping parents and the community members satisfied. No educator deserves to feel like they are running a marathon alone. To counter the stress and help with staff morale, I’ve seen schools invest heavily in manufactured team-building exercises. I often wonder if they may have gotten more mileage (pun intended) simply from a dashboard, such as one that encourages actual team exercise.
At Five Star we help schools mobilize their team and create an unwavering determination to move forward and make students and staff successful on their journey. So, whether you are trying to identify students with learning loss during a pandemic, monitoring student engagement in remote learning, or simply trying to energize your team around a common goal, we can help you take that first step, keep you on pace, and cheer you on as you cross the finish line.
For ideas and contact information on how to create a movement with data for your district, visit fivestartech.com/data-analytics.
Written by Brad Fischer
Senior Director of Data Analytics
Five Star Technology Solutions