
Surviving the Storm: What Can We Learn from ILEARN?


Written by Brad Fischer
Senior Director of Data Analytics
Five Star Technology Solutions
Last summer, school administrators and teachers prepared for a category 5 hurricane, named COVID-19, as it steadily approached their shores. Evacuating wasn’t an option. They had to hunker in place and reinforce, reinvent, and build/rebuild structures (hybrid learning, online learning, social-distant at-school learning) that could both protect and prepare their students. They worked relentlessly to bring a sense of normalcy to a situation that was anything but normal—fighting through the violent winds, pouring rain, and surging sea levels of concerned parents, confused students, and contradictory guidelines. And now, as they huddle together during a break in the clouds after a year filled with surprises, sacrifices, and sorrow, they must find a way to pick up the pieces and move forward.
Identifying students who have fallen behind in their learning and determining where to take action are a few of the first critical steps in the recovery. In Indiana, schools have started to receive results of ILEARN, the state-wide assessments administered to students in grades 3-8. Unfortunately, getting the answers they seek from the data often in itself becomes challenging. And, in a year when everything has been hard, school administrators deserve something easy.
At Five Star, we help make data analytics easy for schools. Here are just a few features of our Pivot Data Warehouse and Student Learning Dashboards that allow administrators and teachers to quickly identify students needing additional support:
1. Bubble Filter – Quickly identify groups of students who fall right outside of a certain proficiency level. When using the bubble filter, set the point value above and/or below the appropriate proficiency level to identify student scores within that range.
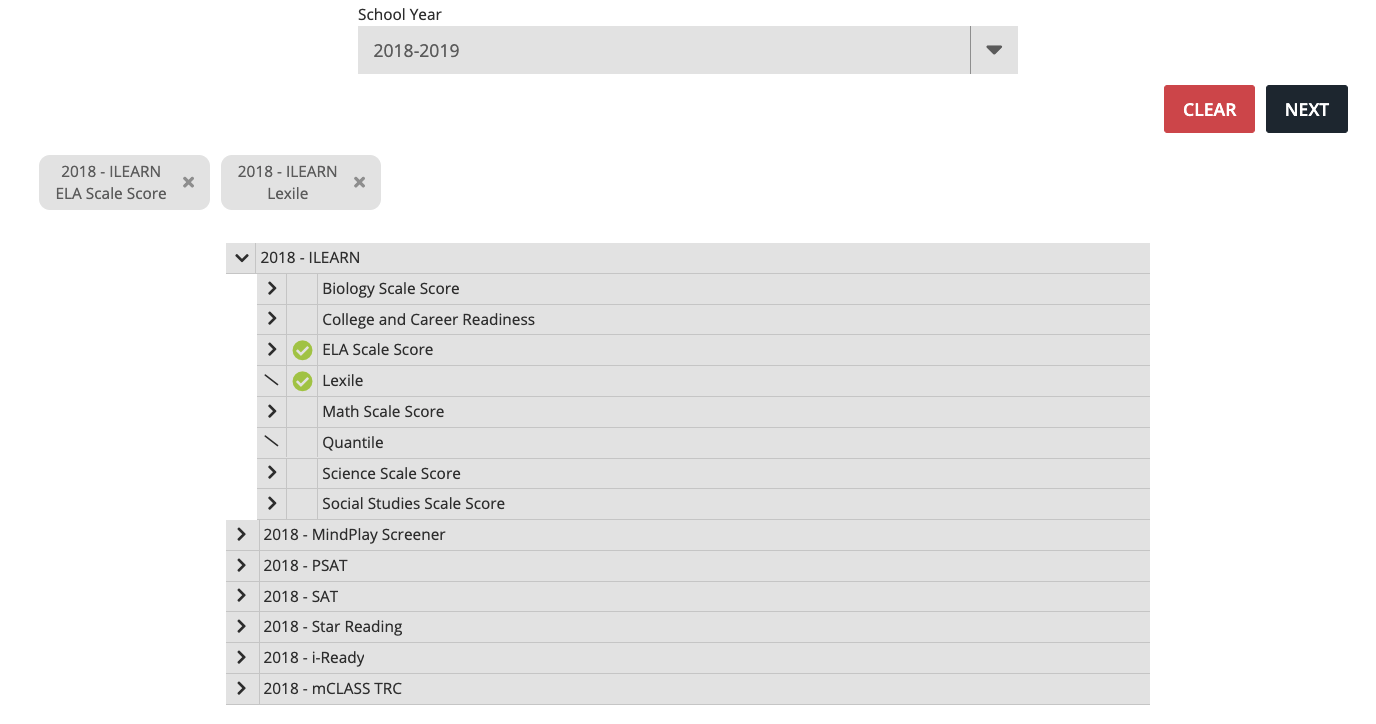
2. Report Builder – Take control of your data and hand select scores across multiple assessments for multiple years to identify trends in student achievement. For example: Select 2018-2019 and 2020-2021 ILEARN data for a group of students and compare results side by side in just a few clicks!
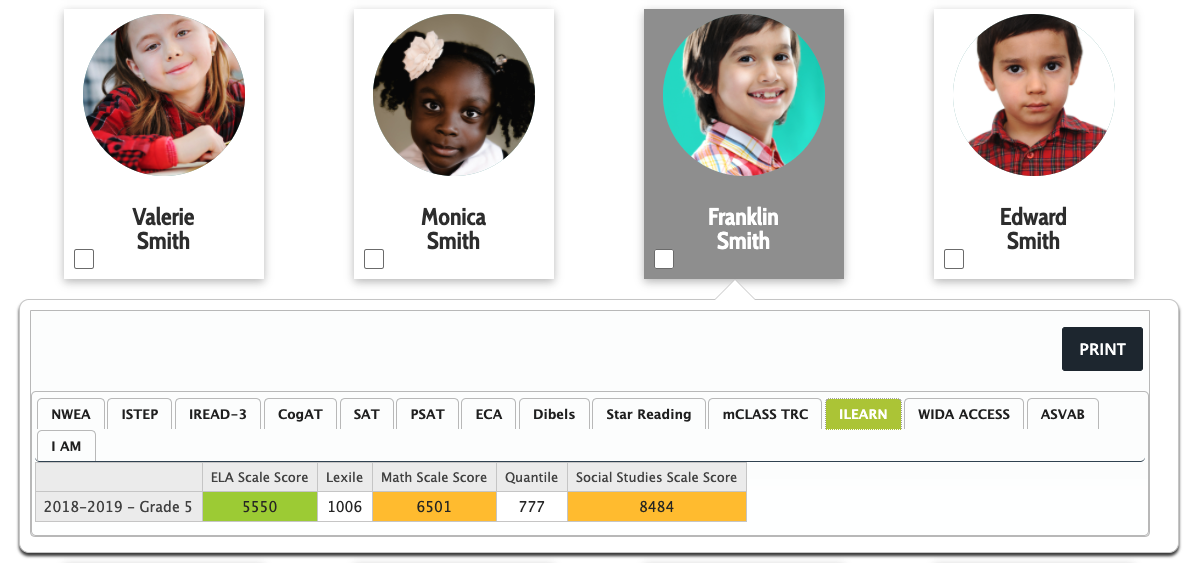
3. Student Data Cards – Search for an individual student to access their Student Data Card. This allows you to view longitudinal data for a student in one place. Quickly view how a student has performed on ILEARN, IREAD-3, and other assessments across time in one simple view. In addition, there is a printable document with all of the student’s achievement data on one page.
4. Personalized Student Learning Dashboards – For schools who want to make their data reporting experience even more seamless, we can provide intuitive dashboards with answers to your targeted questions on student learning.
At Five Star, we help schools Do Data Differently. Our data analytics team allows you to load your data differently, look at your data differently, and leverage your data differently. We not only want to help schools survive this storm, but we want to help you build back better than before.
For ideas and contact information on how your school can partner with Five Star to support student learning visit fivestartech.com/data-analytics.